


This post originally appeared on the Content Marketing Institute website with the title, How to Score Your Content Assets for Long-Term Success.
Want a balanced and actionable way to know whether your content is doing what it’s supposed to do? Create a content scorecard.
A content scorecard allows for normalized scoring based on benchmarks determined by the performance of similar content in your industry or your company’s content standards.
It marries both qualitative and quantitative assessments. Quantitative scores are based on performance metrics such as views, engagement, SEO rank, etc. Qualitative scores are derived from predetermined criteria, such as readability, accuracy, and voice consistency (more on that in a bit).
Let’s get to work to create a content scorecard template you can adapt for your situation.
Establish Your Quantitative Success Indicators
First, you must measure what matters. What is the job for that piece of content?
For example, an index or landing page is rarely designed to be the final destination. If a reader spends too long on that kind of page, it’s likely not a good sign. On the other hand, a long time spent on a detailed article or white paper is a positive reflection of user engagement. Be specific with your content goals when deciding what to measure.
What should you measure based on the content’s purpose? Here are some ideas:
- Exposure – content views, impressions, backlinks
- Engagement – time spent on page, clicks, rating, comments
- Conversion – purchase, registration for gated content, return visits, click-throughs
- Redistribution – shares, pins
After you’ve identified your quantitative criteria, you need to identify the benchmarks. What are you measuring against? Industry standards? Internal standards? A little of both?
A good starting point for researching general user behavior standards is the Nielsen Norman Group. If you seek to focus on your industry, look at your industry marketing groups or even type something like “web metrics for best user experience in [INDUSTRY].”
Below is a sample benchmark key. The left column identifies the metric, while the top row indicates the resulting score on a scale of 1 to 5. Each row lists the parameters for the metric to achieve the score in its column.
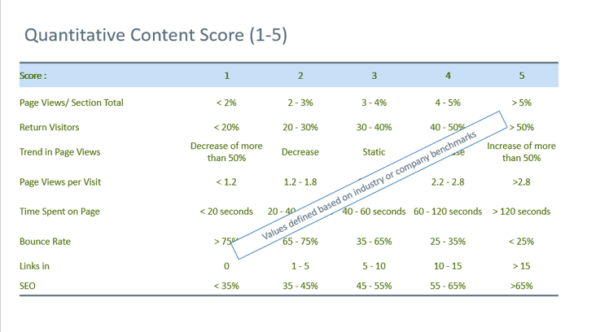
Using a 1-to-5 scale makes it easier to analyze content that may have different goals and still identify the good, the bad, and the ugly. Your scorecard may look different depending on the benchmarks you select.
How to Document Quantitative Findings
You will create two quantitative worksheets.
Label the first one as “Quantitative benchmarks.” Create a chart (similar to the one above) tailored to identify your key metrics and the ranges needed to achieve each score. Use this as your reference sheet.
Label a new worksheet as “Quantitative analysis.” Your first columns should be content URL, topic, and type. Label the next columns based on your quantitative metrics (i.e., page views, return visitors, trend in page views).
After adding the details for each piece of content, add the score for each one in the corresponding columns.
Remember, the 1-to-5 rating is based on the objective standards you documented on the quantitative reference worksheet.
Determine Your Qualitative Analytics
It’s easy to look at your content’s metrics, shrug, and say, “Let’s get rid of everything that’s not getting eyeballs.” But if you do, you risk throwing out great content whose only fault may be it hasn’t been discovered. Scoring your content qualitatively (using a different five-point scale) helps you identify valuable pieces that might otherwise be buried in the long tail.
In this content scorecard process, a content strategist or someone equally qualified on your team/agency analyzes the content based on your objectives.
TIP: Have the same person review all the content to avoid any variance in qualitative scoring standards.
Here are some qualitative criteria we’ve used:
- Consistency – Is the content consistent with the brand voice and style?
- Clarity and accuracy – Is the content understandable, accurate, and current?
- Discoverability – Does the layout of the information support key information flows?
- Engagement – Does the content use the appropriate techniques to influence or engage visitors?
- Relevance – Does the content meet the needs of all intended user types?
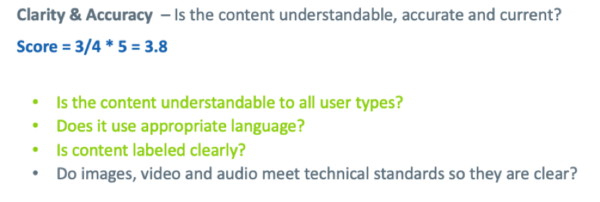
To standardize the assessment, use yes-no questions. One point is earned for every yes. No point is earned for a no. The average qualitative score is then determined by adding up the yes points and dividing the total by the number of questions for the category.
The following illustrates how this would be done for the clarity and accuracy category as well as discoverability. Green highlights indicate a yes answer.
TIP: Tailor the questions in the relevance category based on the information you can access. For example, if the reviewer knows the audience, the question, “Is it relevant to the interests of the viewers,” is valid. If the reviewer doesn’t know the audience, then don’t ask that question. But almost any reviewer can answer if the content is current. So that would be a valid question to analyze.
How to Document Qualitative Findings
Create two qualitative worksheets.
Label the first worksheet “Qualitative questions.”
The first columns are the content URL, topic, and type. Then section the columns for each category and its questions. Add the average formula to the cell under each category label.
Let’s illustrate this following on the example above:
After the content details, label the next column “Clarity and accuracy,” and add a column for each of the four corresponding questions.
Then go through each content piece and question, inputting a 1 for yes and a 0 for no.
To calculate the average rating for clarity and accuracy, input this formula into the cell “=(B5+B6+B7+B8)/4” to determine the average for the first piece of content.
For simpler viewing, create a new worksheet labeled “Qualitative analysis.” Include only the content information accompanied by the category averages in each subsequent column.
Put It All Together: Your Content Scorecard Spreadsheet
With your quantitative and qualitative measurements determined, you now can create your scorecard spreadsheet.
Here’s what it would look like based on the earlier example (minus the specific content URLs).
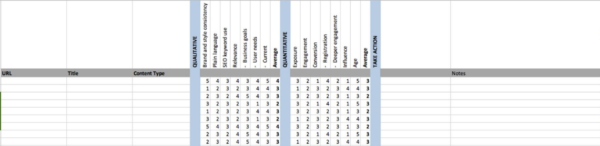
On the scorecard, an “average” column has been added. It is calculated by totaling the numbers for each category and dividing it by the total number of categories.
Now you have a side-by-side comparison of each content URL’s average quantitative and qualitative scores. Here’s how to analyze the numbers and then optimize your content:
- Qualitative score higher than quantitative score: Analyze your distribution plan. Consider alternative times, channels, or formats for this otherwise “good” content.
- Quantitative score higher than qualitative score: Review the content to identify ways to improve it. Could its quality be improved with a rewrite? What about the addition of data-backed research?
- Low quantitative and qualitative scores: Remove this content from circulation and adapt your content plan to avoid this type of content in the future.
- High quantitative and qualitative scores: Promote and reuse this content as much as feasible. Update your content plan to replicate this type of content in the future.
Of course, there are times when the discrepancy between quantitative and qualitative scores may indicate that the qualitative assessment is off. Use your judgment, but at least consider the alternatives.
Get Going
When should you create a content scorecard? While it may seem like a daunting task, don’t let that stop you. Don’t wait until the next big migration. Take bite-size chunks and make it an ongoing process. Start now and optimize every quarter, then the process won’t feel quite so Herculean.
Selecting how much and what content should be evaluated depends largely on the variety of content types and the consistency of content within the same type. You need to select a sufficient number of content pieces to see patterns in topic, content type, traffic, etc.
Though there is no hard and fast science to sample size, in our experience 100 to 200 content assets were sufficient. Your number will depend on:
- Total inventory size
- Consistency within a content type
- Frequency of audits
Review in batches so you don’t get overwhelmed. Set evaluation cycles and look at batches quarterly, revising, retiring, or repurposing your content based on the audit results every time. And remember to select content across the performance spectrum. If you only focus on high-performing content, you won’t identify the hidden gems.