


Sometimes your content doesn’t do what it’s supposed to do. It goes unread, it fails to convert, it cues the sad trombones. That’s par for the course in marketing, as we all know, and successful marketers embrace their failures and seek out the lessons learned.
The problem is that many marketers don’t have effective tools and processes to evaluate their content. Does your latest blog post deserve an A+ or a C-? Which of its attributes are working well, and which are falling short? Without content scoring insights, you can’t diagnose what went wrong to fix it.
As marketing budgets look to get tighter in 2021, nobody can afford to create content without this level of awareness; nobody can afford to repeat the same mistakes.
That’s why a content scorecard is an indispensable tool for today’s content marketers and content strategists. And I’m going to show you how to create your own.
When you put a scorecard into action, you gain a comprehensive, balanced view of your content’s strengths and weaknesses. And with that information in hand, you can identify issues more accurately and optimize existing content to improve its score over time—and do its part to help you meet your marketing goals.
What Is a Content Scorecard?
A content scorecard is a template-based tool that allows you to evaluate your content both quantitatively and qualitatively:
- Quantitative scores are based on content performance metrics such as sessions, unique visitors, downloads, or SEO rank.
- Qualitative scores result from expert or programmatic review of the quality of your content, evaluating criteria such as readability, accuracy, and brand and style consistency.
The secret sauce of content scoring is made up of these two ingredients: quality and performance. You have to include both in your scorecard to get a rich result. Data-driven marketers may want to focus only on performance metrics, and marketing creatives might emphasize editorial quality, but it’s never one or the other.
For example, you might have a valuable, high-quality infographic whose pageviews are low because it isn’t discoverable on your site. Or maybe its subject isn’t a hot topic today, but it will be in another year, with a long-tail payoff over time. Your content scorecard will weigh all these factors.
Attributes of Your Content Scorecard
Here are some of the fundamental guidelines for creating your customized content scorecard:
- Each qualitative and quantitative attribute should be scored using a clear and consistent scoring system, such as a 1-to-5 scale (5 is highest, 1 lowest).
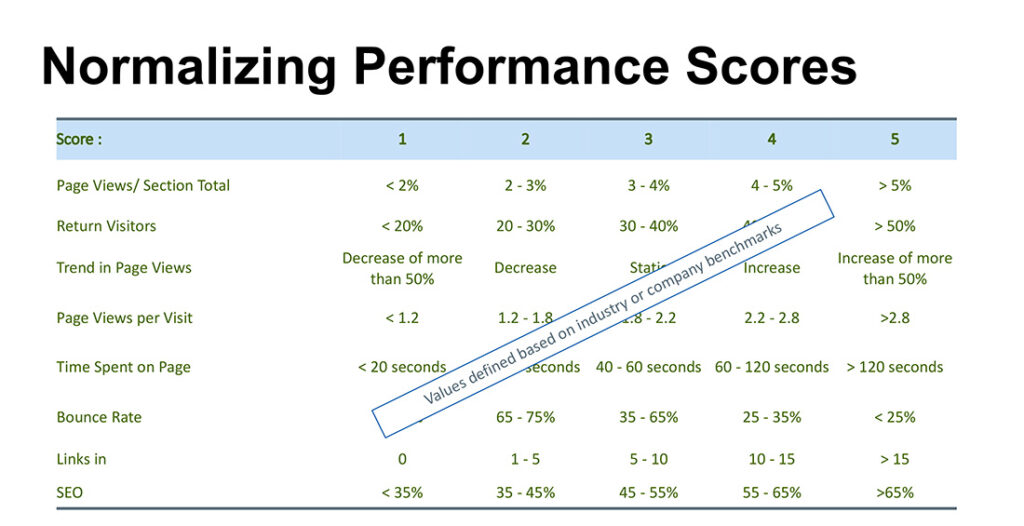
- Your scorecard must be customized for your company or your industry. There’s no one-size-fits-all approach. That means scores are normalized and benchmarked against similar content or against your company’s content standards. It’s up to you to determine what constitutes a “5” for pageviews or bounce rate. For an example of this reference worksheet, view the image below, “Normalizing Performance Scores.”
- You can score any and all content types: webpages, landing pages, ebooks, blog posts, etc. Consider scoring content in batches or as part of a content audit. You may also want to use automation tools like Screaming Frog to crawl your site and inventory your pages, then add metrics via tools like Google Analytics.
- Your scorecard should be a spreadsheet. Your data, both quantitative and qualitative, can first be captured and tabulated on separate worksheets, and then combined on your final scorecard. See below for a sample of what it can look like.
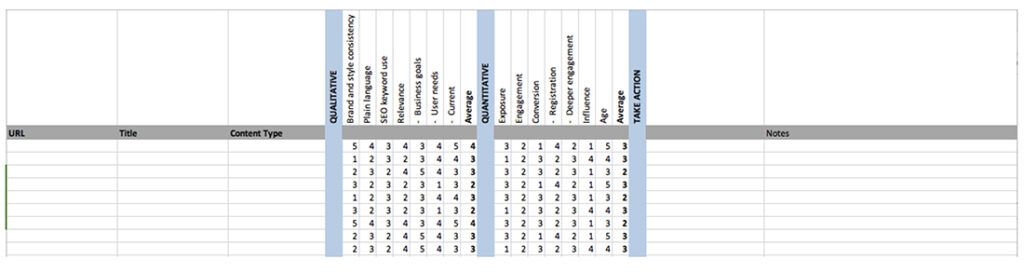
Scoring Your Quantitative Attributes
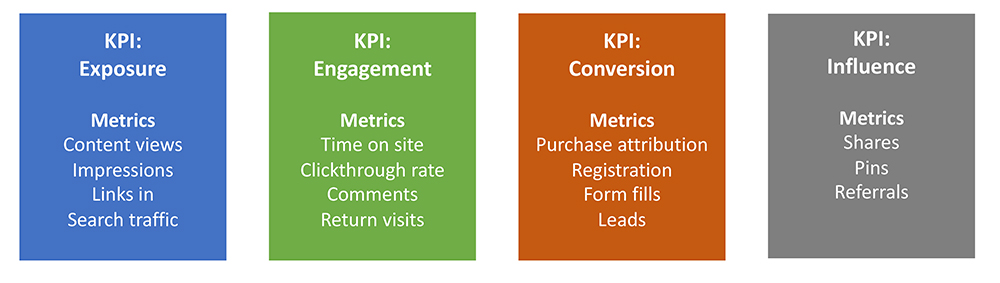
Start by determining which KPI categories you will include in your quantitative scores, and then which individual metrics to include in each category. See the graphic below for ideas.
Once you know your KPIs, you need to establish your company or industry benchmarks for each one; then create your 1-to-5 scale for each metric. (See image, “Normalizing Performance Scores.”)
A Closer Look at Quality Scoring
To analyze the quality of an individual piece of content, you can score it across five KPIs:
- Brand and style consistency
- Clarity and accuracy
- Discoverability
- Relevance
- Engagement
Within each of those KPIs, run through the list of questions below and answer them in your worksheet, awarding 1 point for each “yes” and a 0 for “no.”
- Brand and style consistency
- Is the visual content consistent with the brand and established web style?
- Does the editorial content reflect the brand voice and attributes?
- Is the tone adjusted appropriately to the context — e.g., customer challenge vs. product?
- Does the content have a consistent style across your digital ecosystem?
- Clarity and accuracy
- Is the content understandable to target user types?
- Is all content labeled clearly?
- Are value propositions clearly and boldly stated?
- Do images, video, and audio meet technical standards so they are clear?
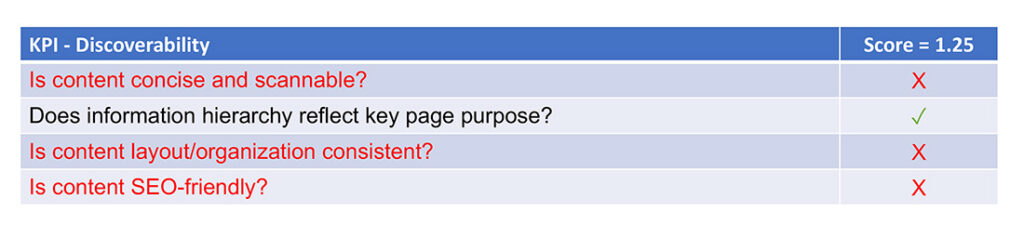
- Discoverability
- Is content concise and scannable?
- Does information hierarchy reflect key purpose of the asset or page?
- Is content layout/organization consistent?
- Is content SEO-friendly?
- Relevance
- Are the needs of all relevant user types met?
- Does it address users’ challenges? (what is the intent?)
- Is content relevant to company’s offering?
- Is content topical and updated?
- Engagement
- Does the content use the appropriate techniques to influence visitors?
- Is the content visually engaging?
- Does the visual design support the text?
- Does content clearly communicate specific and helpful calls-to-action?
Add up your scores and then calculate an average for each KPI, normalized on a 1 through 5 scale.
Analyzing Scores to Diagnose Content Issues
Now for the fun part: reviewing your quantitative and qualitative scores to find strengths, weaknesses, and opportunities for improvement.
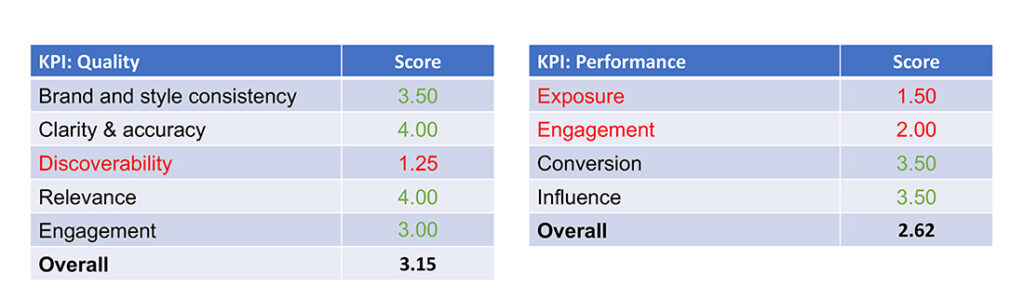
Start by looking at the big picture and compare a content asset’s qualitative score with its quantitative score. Here are a few possible takeaways:
- Qualitative score > quantitative score: Consider your distribution plan or rethink your evaluation criteria.
- Quantitative score > qualitative score: Consider a rewrite or rethink your evaluation criteria.
- Both low: Remove from circulation and adapt your content plan.
- Both high: Promote, reuse, and adapt your content plan.
Next, examine your KPIs to find the low scores (or any that look concerning to you) and then revisit your qualitative or quantitative worksheet to view the detailed scores that can identify what’s going wrong and how to fix it. Document the issue and the “action step” on your scorecard, such as revising, retiring, or repurposing content.
Build Content Scoring and Optimization into Your Workflow
Setting up your customized scorecard will take some time at the outset, but it’s long-term ROI is worth the effort. After you put your scorecard into use, you’ll see how it helps you make better, more cost-effective content decisions.
Your next step is to bake scoring and optimization into your content workflow.
For many marketers, the content production process is linear: plan, create, distribute. But content scoring reveals that this process should actually be circular: after you distribute content, you should add two more steps: assessment (aka, scoring) and optimization. Over the lifetime of a given piece of content, you can score and optimize it repeatedly. I recommend doing this quarterly and building it into your workflow. (Pro tip: Schedule review dates for content in your CMS). As you continually adapt your content, you should see its score improve over time, increasing the ROI of your content investments.
Talk to Tendo
Let the content strategists at Tendo build a content scorecard that is customized for your organization. Learn more about our content strategy and experience services, or contact us today.