Welcome to the world of content analytics. It’s kind of the Wild West out here, with vast unexplored territory, scary unknowns, and yet—the promise of gold.
The ability to measure the success of your content (and present your findings to clients and stakeholders) is what brings B2B marketers to the land of comparison charts, KPIs, and Google Analytics reports. But all too often, well-meaning content teams lose their way.
With so many tools, metrics, and—let’s face it—bad advice out there, valuable data gets wasted or becomes unactionable. To assist you on your journey into content analytics, here are the basics you need to know, the top seven content metrics to adopt, and common pitfalls to avoid.
Content Analytics 101: Why Content Metrics Matter
- What is content analytics?
Content analytics refers to the practice of studying data (such as engagement, downloads, or page views) to measure the impact of your content or to research trends in audience interests and behavior.
- Why bother with content analytics?
You need to know what’s working. Analyzing content performance can help guide and inform your content strategy and digital marketing strategy. Ultimately, these metrics help determine how well you’re meeting campaign goals as well as overall marketing and business goals.

7 Need-to-Know Content Metrics
Start with these seven metrics to track the health and performance of your content.
1. Pages per Session
- Definition: The average number of pages a visitor views in a session after viewing your piece of content.
- Why it matters: For content marketers, this metric can help determine if your piece of content is engaging the audience the way it should. For example, a high-level product category page should ideally inspire visitors to explore individual products and stay longer on your site.
- How to use: If your pages-per-session metric is underperforming for a piece of content, here’s what you can do: suggest related content to your viewer, design more interactive pages, or use compelling CTA to guide your visitor to more content. Pair with the “average time on page” metric for a more accurate assessment of your piece.
- Beware: Not a perfect metric on its own, and depending on your tool, multiple visits from the same visitor will be counted.
2. Number of Asset Downloads
- Definition: The number of times an asset, such as an e-book or playbook, is downloaded.
- Why it matters: Download rates can determine which assets or topics are resonating with your audience and identify gaps in your content strategy. It is also one touchpoint that can assist with finding marketing-qualified leads (MQLs).
- How to use: Like many metrics, this one shouldn’t be evaluated on its own, as there are many reasons why your downloads could be underperforming. If your asset downloads are low, consider re-evaluating who you’re targeting, if and how you’re gating content, and experimenting with CTA copy and its position on the page.
3. New vs. Returning Users
- Definition: New users are first-time visitors to your site, while returning users are those who have visited your site multiple times.
- Why it matters: Watching new visitors can help you spot trends and gauge effectiveness of marketing campaigns. Meanwhile, analyzing returning visitors can indicate customer loyalty and signal that your content is engaging.
- How to use: Use this metric—along with other engagement indicators such as pages per session and session duration—to get a better idea of what types of content your audience responds to.
- Beware: Note that these numbers may be skewed based on the visitor’s browser and cookie usage.
4. Traffic Sources
- Definition: Traffic sources that are driving visitors to your content.
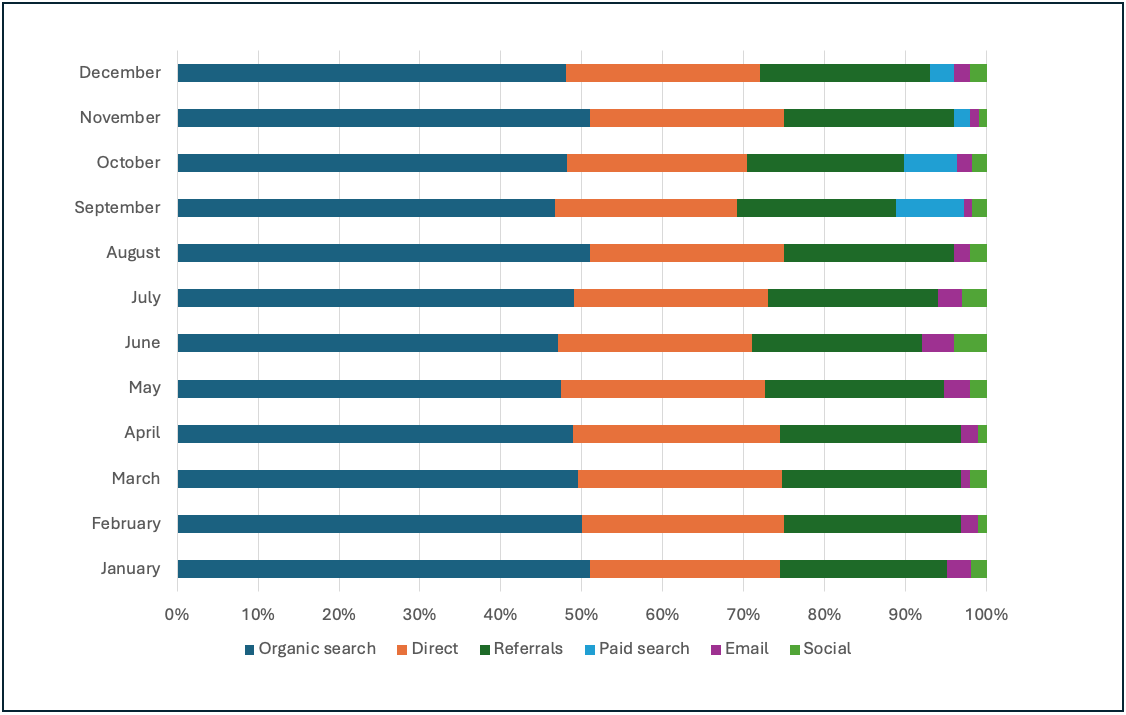
- Why it matters: This metric can identify popular sources of traffic (e.g., direct, organic search, email, social), which identifies how to best reach your audience.
- How to use: Investigating traffic sources can help determine which channels are working best, so you can prioritize them and reach your audience where they are. Traffic source insights can also help determine if a campaign or affiliate partnership was successful, and inform investment opportunities for more content, advertisements, or relationship-building in the future.
- Beware: Best viewed with other metrics—such as bounce rate and average time on site—to get a more accurate view of which traffic sources result in meaningful visits.

5. Attributable Leads
- Definition: A lead generated by marketing efforts that can be tracked back to a specific piece of content.
- Why it matters: By identifying leads directly tied to content, this data demonstrates how the marketing content team influences your company’s bottom line. It allows marketing to differentiate its efforts from the sales team, while capturing where in the funnel your content is being consumed.
- How to use: Set up a call to action at the end of your content pieces, which is a reliable indicator that the piece of content has been viewed. If viewers are not responding to the CTA, this may indicate issues with the content, targeting, or CTA itself.
- Beware: Don’t track leads through gating forms. Form fills only signify that the gating form is successful—not your actual piece of content.
6. Bounce Rate
- Definition: The percentage of viewers who leave your content after visiting one page.
- Why it matters: A low bounce rate can signal deeper user engagement. Meanwhile, a high bounce rate indicates pogo stick behavior that can flag issues with your content, performance, and/or user experience.
- How to use: Investigate pages with the highest bounce rates: Why are visitors bouncing? Is it a content issue or navigation problem? Were visitors misled by search results?
- Beware: A high bounce rate isn’t always a bad thing. For example, if visitors have landed on a shipping confirmation page, you can expect a quick exit.
7. Conversion Rate
- Definition: The rate of a completed activity, such as signing up for a newsletter, registering for a webinar, or requesting a demo.
- Why it matters: A high conversion rate reveals your audience is doing what you wish—congratulations! If you have a conversion rate you’d like to improve, this is a good time to evaluate your content and overall strategy.
- How to use: If conversion rate is suffering, consider adjusting factors like your CTA text and CTA page positioning. If you’re not familiar with Google Analytics 4 (GA4), now is a good time to research it. For a session to qualify as engaged, GA4 requires a conversion event, among other criteria.
- Beware: Not all content needs to drive conversion. Depending on the journey stage, the job of a given content asset might be engagement rather than conversion.
Mining Marketing Content Analytics Data without Losing Your Mind
Setting up a solid marketing content analytics strategy is where many content teams flounder. Common temptations include tracking too many content metrics, sporadically moving from one metric to another, or failing to follow up on reports. Here are best practices to avoid these pitfalls:
Get Clarity on Your High-Level Goals
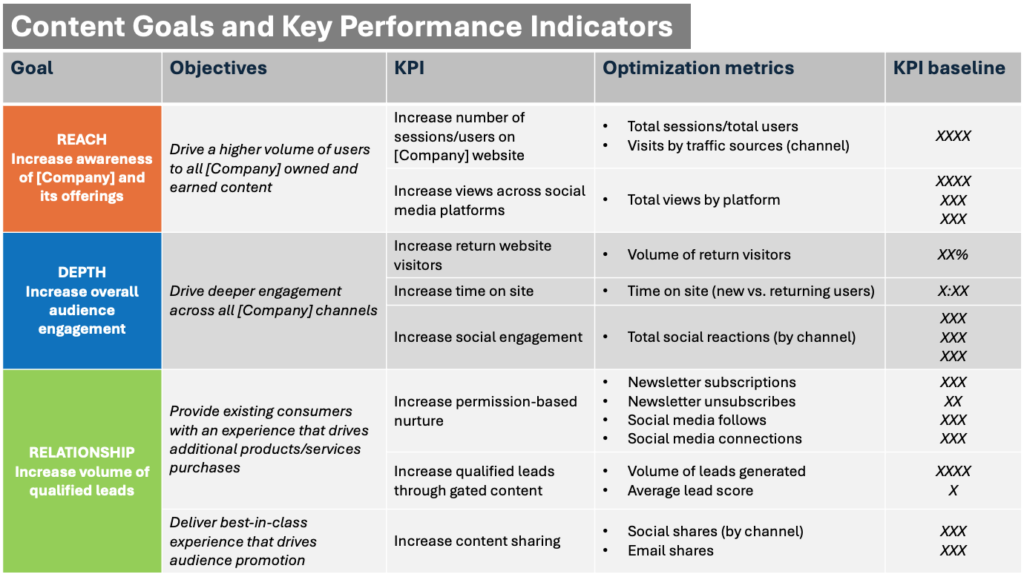
Effective content creation should always support your company’s overall marketing efforts. At the start of your content analytics journey, determine high-level business or marketing goals, such as increasing brand awareness or audience engagement. Use these goals as a touchstone to guide strategy and future updates.
Assign Meaningful and Measurable KPIs
Selecting effective key performance indicators (KPIs) can be an art, as they serve as the connective tissue between your goals and metrics. Not only should KPIs be meaningful to your goals, they should be supported by metrics that are measurable and trackable.

Dump the “One Size Fits All” Mindset
In your search for the right metrics, realize they’ll differ depending on your specific campaign, larger marketing goals, and overall business direction. Be wary of vanity metrics such as social media likes and follows, which are easily attainable, but often difficult to tie to conversions.
Be Consistent when Analyzing Content
When building out a marketing content analytics strategy, start simple and be consistent with follow-up. Establish historical baselines for a clear snapshot of your past performance, and check in weekly, monthly, or quarterly to evaluate performance and adjust your strategy as needed.
Turn Your Content Analytics into Content Gold
As a marketer or B2B business, understanding your content metrics helps you produce meaningful, actionable content. However, tracking quantitative data, such as views and downloads, only provides so much insight.
For a more complete evaluation, make sure your reports include qualitative analytics, which examine content clarity, discoverability, and relevance. Using a tool like a content scorecard can help you make better decisions to ensure content gold.
Develop and Refine Content Analytics with Tendo
Tendo helps B2B companies like yours develop a content analytics strategy, defining key metrics and creating plans based on actionable insights. Try our proprietary content scorecard today, or contact us to explore how we can help.
First published October 6, 2021


