If you’ve been keeping an eye on the world of web analytics, the buzz surrounding Google Analytics 4 (GA4) is already on your radar. But how exactly is it changing the way you measure user engagement?
For one, critical data about your website’s performance might look unrecognizable. Designed to keep up with evolving user behaviors, GA4 calculates many familiar metrics in new ways. To maximize how you use it to assess and improve your website, you need to reevaluate your approach to content measurement.
Whether your new user engagement measurement strategy is in development, or you’re not sure how to begin with GA4, keep reading. We’ll answer all your questions, including:
- What is GA4?
- Why did GA4 replace UA?
- What are the GA4 user engagement updates?
- How do the changes affect content measurement?
What Is GA4?
Google launched GA4 in 2023 to replace its former analytics service for websites and applications, Universal Analytics (UA). But GA4 isn’t just a simple upgrade. It’s a whole new interface with updated features and metrics, particularly for user engagement.
Well-understood user engagement metrics like bounce rate now look a lot different. Plus, GA4 includes fresh metrics like engaged sessions and engagement rate. To keep your site competitive, you need to understand these changes and quickly adjust your approach to content measurement.
Why Did GA4 Replace UA?
Before diving into the GA4 user engagement updates, it’s important to understand why GA4 replaced UA.
UA was built in the early 2000s. During that time, Internet Explorer was the most common web browser and the BlackBerry was the most common mobile device, as Jeff Sauer explains in his SEO for GA4 course. Obviously, a lot has changed and GA4 aims to get up to date.
Google cites three main reasons for the switch from UA to GA4:
- To expand beyond desktop-focused web and better incorporate other platforms
- To move away from a reliance on data from cookies
- To respond to evolving data privacy concerns by creating a tool with “privacy at its core”
Now that we’ve set the scene, let’s take a closer look at the details.
What Are the GA4 User Engagement Updates?
GA4 came with a host of new features. One of the most significant is the engaged sessions metric.
What Is an Engaged Session in GA4?
To count as engaged, a session must meet one or more of the following criteria:
- Lasts longer than 10 seconds (although you can customize this timing in GA4)
- Has a conversion event (which you can create by adding events and marking them as conversions)
- Has at least 2 page views or screen views
Unlike regular sessions, simply defined as user interactions within a specific timeframe, engaged sessions have to meet the additional criteria above. They allow you to track more meaningful interactions on a site.
Engaged sessions also inform new metrics including engagement rate (engaged sessions/sessions), engaged sessions per user, and average engagement time.

What Happened to Bounce Rate in GA4?
Bounce rate is historically one of the must-know metrics for user engagement. But with GA4, you might’ve noticed that bounce rate is harder to find and measured much differently.
Previously, UA counted a session as a bounce if it only included one interactive event (usually one page view). For example, even if a user stayed on a page for an extended time before leaving, the session was a bounce if the user didn’t have a subsequent interactive event.
In GA4, a bounce is now the inverse of an engaged session. So, bounce rate plus engagement rate is always 100%. This means that if a session meets all the following criteria (which you’ll recognize from the engaged session definition), it’s a bounce:
- Lasts fewer than 10 seconds
- Does not have a conversion event
- Does not have at least 2 page views or screen views
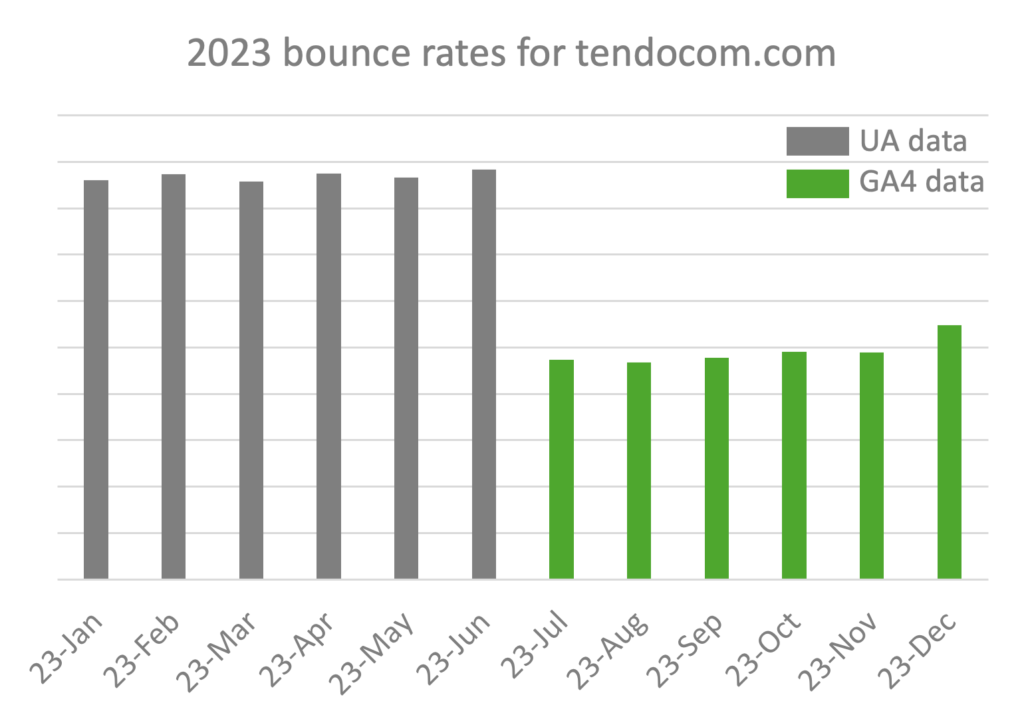
Now, if a user stays on a page for more than 10 seconds—even without interacting—it’s no longer counted as a bounce. This means bounce rate is usually a lot lower in GA4 than UA.
So, why did this happen? As Jessica Propst from Seer Interactive puts it, “GA4 is much more event and action-oriented than Universal Analytics. With this shift, it doesn’t make as much sense to have a metric describing inactivity on the site.”
GA4’s new engagement metrics, specifically engagement rate, are designed to be an alternative to bounce rate. The goal is to prioritize activity over inactivity.
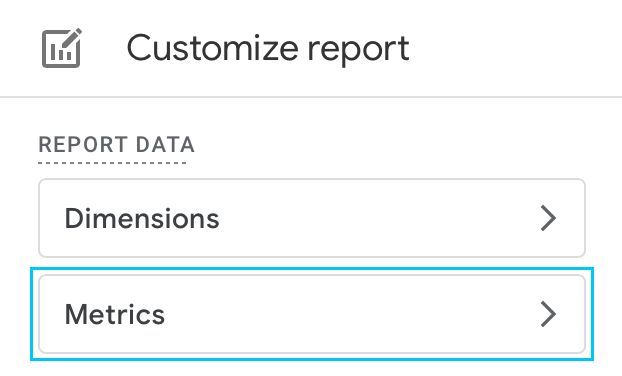
In fact, when GA4 first came out, Google excluded bounce rate completely but brought it back after some backlash. So, if you’re a loyal bounce rate fan, you can find it tucked away in the list of metrics you can add to customize a report.

How Do GA4 Changes Affect Content Measurement?
Whether you’re creating reports or just viewing website data, the GA4 user engagement updates affect a few key areas of your work. This is especially true if you’re still interested in bounce rate data.
Here are three areas that require a new approach and tips to help you get started:
1. Tracking Performance over Time
Assessing year-over-year or month-over-month bounce rate performance before and after GA4 isn’t a one-to-one comparison.
You may be misled by the immediate, significant reduction in bounce rates after moving to GA4. These changes aren’t necessarily the result of improvements to the site or its content (sorry to disappoint). Bounce rate is just measured differently.

In addition to bounce rate, GA4 measures other metrics differently (users, sessions, conversions, and more). If you notice a major shift in performance, refer to this article from Google to see if the changes can be attributed to GA4 updates.
Tip: Avoid direct comparisons between bounce rate data before and after GA4. Instead, analyze each timeframe separately and communicate the context for any changes.
2. Using Industry Benchmarks
What’s a “good” bounce rate for your industry? Well, it depends.
Although GA4 defines and measures bounce rate in a new way, other analytics tools (Adobe Analytics, HubSpot, and more) maintain a traditional approach. That means you can’t always use the same industry benchmarks for bounce rate.
Luckily, many sources have already created updated benchmarks. For example, Databox published GA4 industry benchmarks across key metrics, including bounce rate. GA4 is still new, so these benchmarks are likely to change.
Tip: If you’re looking at Google Analytics data, you need GA4-specific benchmarks.
3. Telling the Whole Story with Data
The new user engagement metrics don’t penalize a page if it captures a user’s attention for 10 or more seconds but doesn’t prompt another interaction. However, if the goal of a page is to drive a certain action, you’ll need more metrics to tell the whole story.
Comparing new user engagement metrics with existing metrics can offer important insights. For example, high engagement rates but low conversions could indicate the need for better CTAs.
You can also track the three criteria for an engaged session as separate metrics (average engagement time, conversions, views per session). If you’re doing a deep dive into user engagement data, it’ll be useful to look at these metrics individually (for example, to compare engagement time versus conversions), rather than rolling them up into one metric.
Tip: Define the purpose of a page (view the content only, drive to another page, fill out a form), and see where the new user engagement metrics can help assess performance. Analyze engagement against other metrics to get the complete picture.
Understand Your User Engagement with Tendo
When you’re used to seeing the same metrics year after year, updates like the ones in GA4 can feel disorienting. But they’re also exciting.
The GA4 user engagement updates are an opportunity to reconsider established approaches and deepen your understanding of content performance. They prompt conversations that help push marketing teams to the next level.
Want to make the most of GA4 data insights and improve your website’s user engagement? Our team of skilled digital marketers and content analysts can help. Learn more about our content performance services.


